The results of the 2022–2023 administration of the Program for International Student Assessment (PISA) were made public by the Organization for Economic Co-operation and Development (OECD) on December 5, 2023.
The PISA 2022 evaluation is the first after the COVID-19 pandemic and evaluates the performance of over 81 countries in reading, science, and mathematics.
The Equitable Education Fund (EEF) cordially invites all individuals to examine the state of educational inequality in Thailand by means of the PISA 2022 assessment findings.
Academician Pawarin Pantivej of the Equitable Education Research Institute (EEFI), who specializes in information and monitoring of educational inequality, provides an overview of the state of educational inequality as it is documented in OECD and EEFI evaluation reports. The entire data was examined with a focus on poor and disadvantaged student groups, classified into four groups (Quantiles 1–4) with 25% of the students in each group, arranged from least to most, based on economic, social, and cultural status.
We shall discover a positive correlation between the kids’ economic situation and the PISA 2022 testing scores for all three disciplines. Put differently, kids who are less fortunate typically receive lower scores than those who are more affluent.
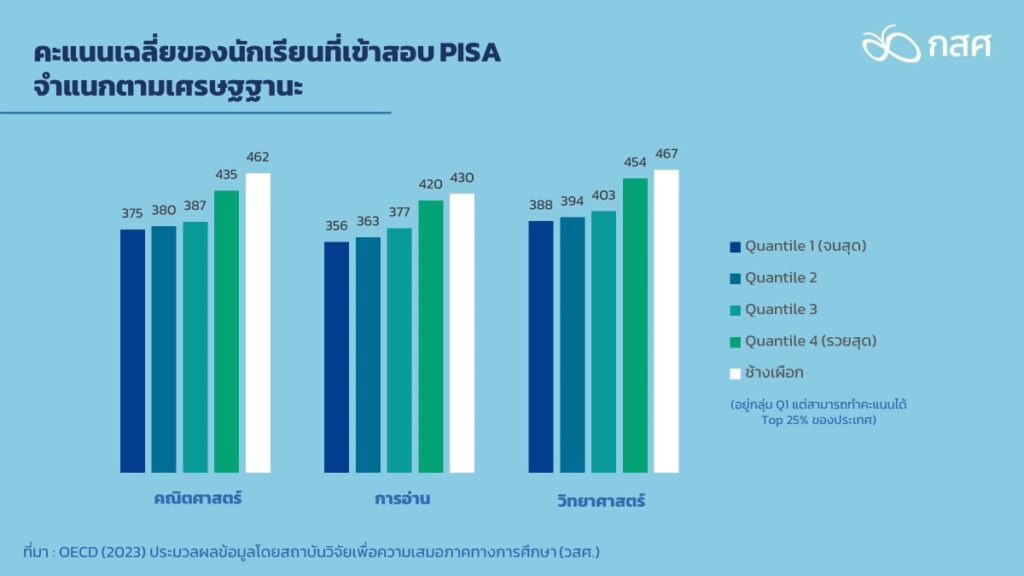
Source: Data processed by Equitable Education Research Institute (EEFI) from the OECD (2023).
There is a discrepancy of roughly 60 to 70 points in each subject when comparing the average scores of the nation’s poorest and richest 25% of pupils. It illustrates the disparity in learning outcomes that change based on the household’s financial circumstances.
Nonetheless, “Academically Resilient Students” still make up the lowest 25% of the country’s student population. They manage to perform well in the top 25% of the country while having an income in the lowest 25% of the nation. According to the results of the mathematics subject evaluation, 15% of the kids in this age group are in the Bottom 25%.
This percentage of 15% is greater than the average for developed countries such as the OECD, where the percentage of children in this category is 10%. With respect to average scores, it does even better than the 25% highest income group in the nation.
The inequality in this image is considerably more pronounced. In terms of Proficiency Levels, pupils who score less than two out of six levels on the proficiency evaluation fall into the category of Low Performers, according to the OECD. When a student achieves a performance level of 5 or 6 on the exam, they are categorized as high performers. In the meantime, it is thought that pupils in the group with competency levels ranging from 2 to 4 have basic to moderate competency in that subject.
Level 2 is the fundamental competency level that permits pupils to fully contribute to the society, according to the OECD, which also defines it as the boundary between below basic level and basic level.
In the case of mathematics, for instance, possessing basic abilities (Level 2) indicates that pupils can apply mathematical reasoning and concepts to solve problems or different scenarios that they might come across in lifetime. When a student needs to get from point A to point B, for instance, and has multiple routes to choose from, they can compute and compare which route will be quicker or slower or which distance will be closer. In real life, one may run across situations like this one.
Reading at the fundamental level (Level 2) in the context of reading refers to the ability of students to comprehend the main ideas of medium-sized publications. In order to determine the author’s objectives, students can look for specific information in an article.
More than 77.43% of pupils with mathematics assessment results below the basic level were among the nation’s poorest 25% of students. Compared to the national average, this is almost 10% higher, and none of the students in the lowest 25% achieved a score of five or six, which is indicative of a Top Performer.
Although students in the richest 25% income group (Top 25%) have the highest percentage of students passing the basic level compared to those who do not pass the basic level among these four income groups, their percentage of Top Performers students is the highest at 4.31%.
Even though the mentioned above Academically Resilient Students outperformed the top group on average by 25%, all of the students scored between basic and moderate levels (Levels 2–4), and none of them were able to reach the Top Performers or Levels 5–6.
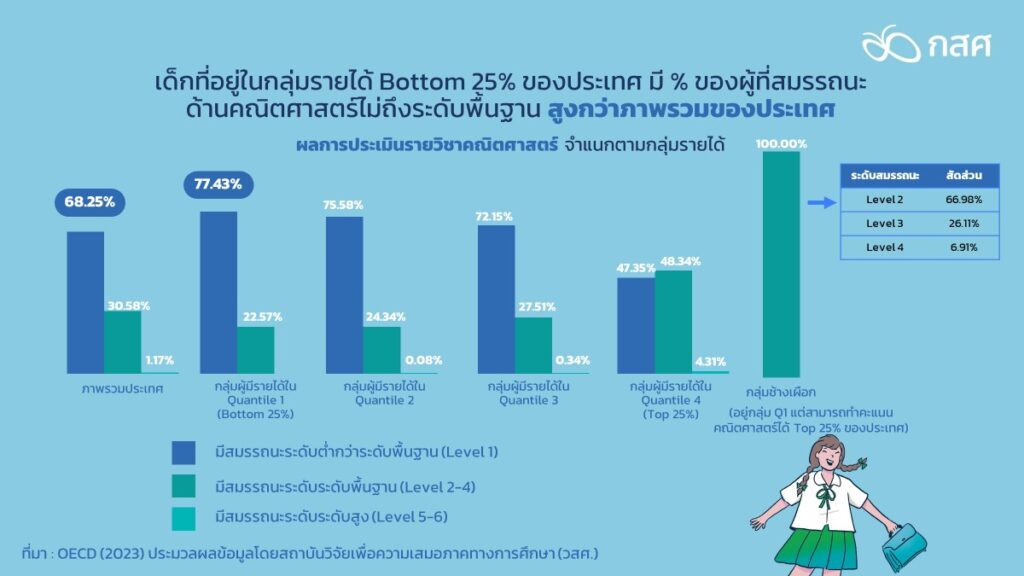
Source: OECD (2023) Data processed by Equitable Education Research Institute (EEFI).
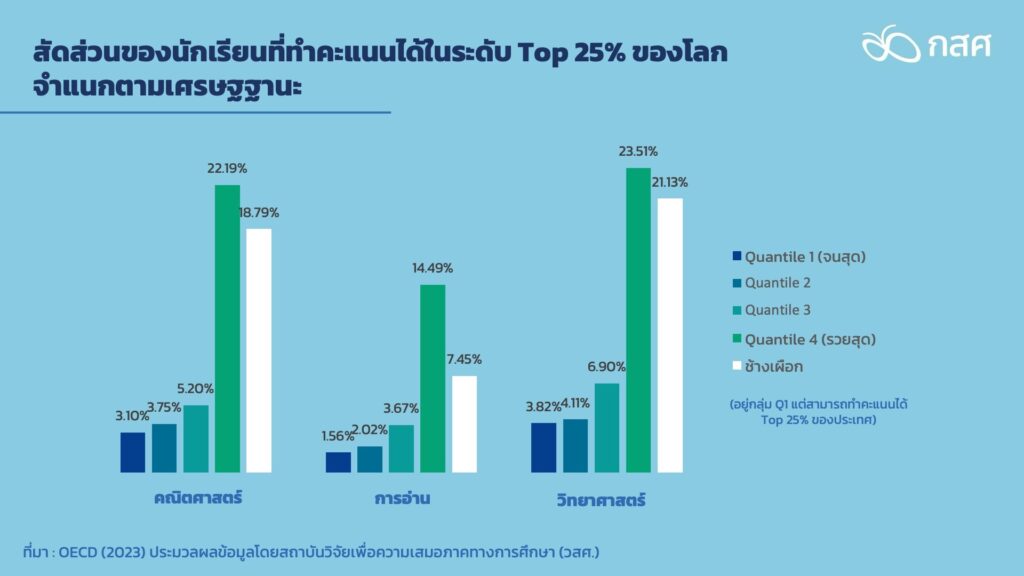
However, if we look at the global score criteria, there will be the poorest 25% of students who can score at the highest level in mathematics. 25% of the world gets only 3.10%. And if we dig into the group of Academically Resilient Students who scored in the top 25% of Thailand, we will find 18.79% of the students who scored in the top 25% of mathematics in the world.
The academic success difference in Thailand relative to the rest of the world is reflected in the 22.19% math scores of the kids in the richest 25% group, who also happen to be among the world’s top 25% in the subject.
Source: Data processed by Equitable Education Research Institute (EEFI) from the OECD (2023).
Academically resilient students do better than their peers who are essentially in the same income bracket, even though they do not rank among the best performers in the world by the OECD’s assessment of a level 5 or 6. The next query is, “So why do these students perform better than other kids from comparable socioeconomic backgrounds?” “Growth Mindset” is the key to solving this.
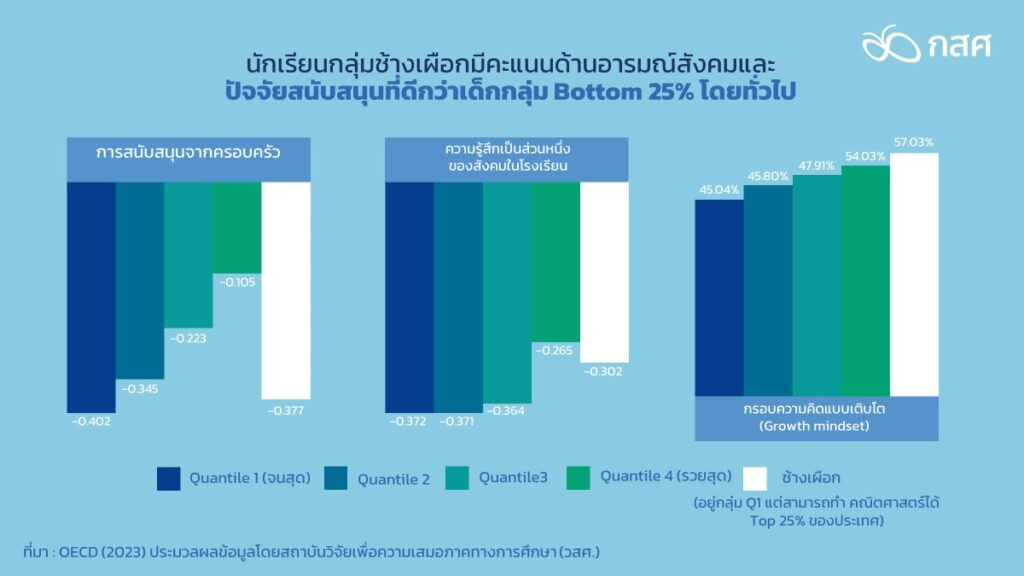
Based on the investigation, we discovered that the percentage of academically resilient children with a growth mindset was as high as 57.03%, which is greater than the percentage of students in all economic groups. Even among the wealthiest 25% of the population, the percentage is comparable to the OECD average of 57.8%.
In addition, if other related environmental factors are considered, it is found that Academically Resilient Students tend to receive support from their families (Family Support) and have a sense of being part of the school society (Sense of Belonging) that is higher than the average of generally poor students. Therefore, it may be that these students receive support from environmental factors from families and schools that fully support them. They can then score PISA and pass this basic level of competency.
Source: Data processed by Equitable Education Research Institute (EEFI) from the OECD (2023).
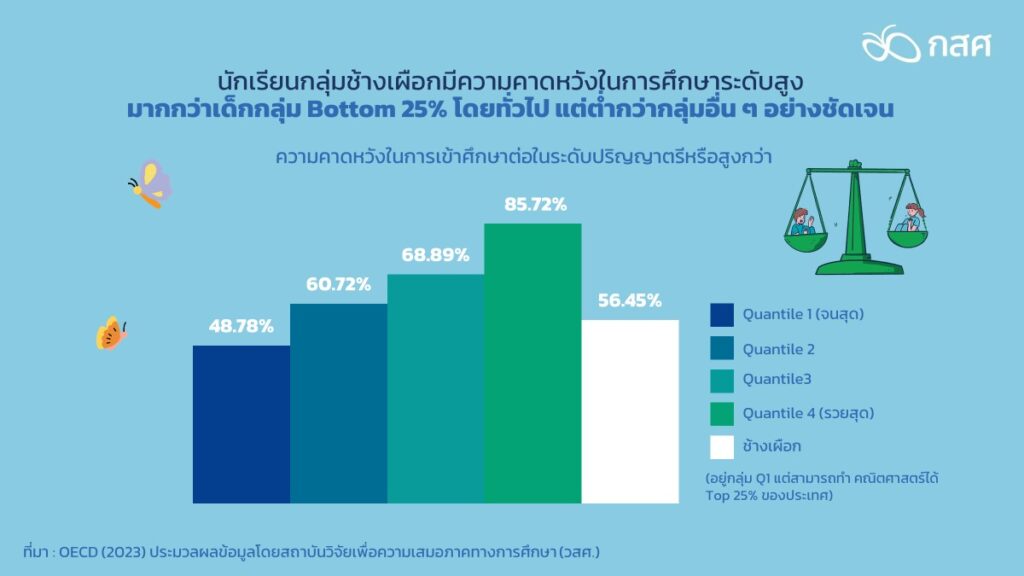
However, when considering the expectations of continuing education at a high level from the bachelor’s degree level and above, it is found that although Academically Resilient Students have higher education expectations than students in the bottom 25% of the poor group, such expectations are still lower than those of students from higher economic status groups.
This information was gathered through interviews with students who had previously passed The Equitable Education Fund’s (EEF) poverty screening. It was discovered that this particular group of students takes into account external factors that may impede their decision to seek higher education, such as limited access to information about sources of scholarships that support higher education or the financial burden of moving from secondary to tertiary education. Because of this, the expectations placed on this group of students to pursue further education continue to be at odds with their academic aptitude and growth attitude.
Source: Data processed by Equitable Education Research Institute (EEFI) from the OECD (2023).
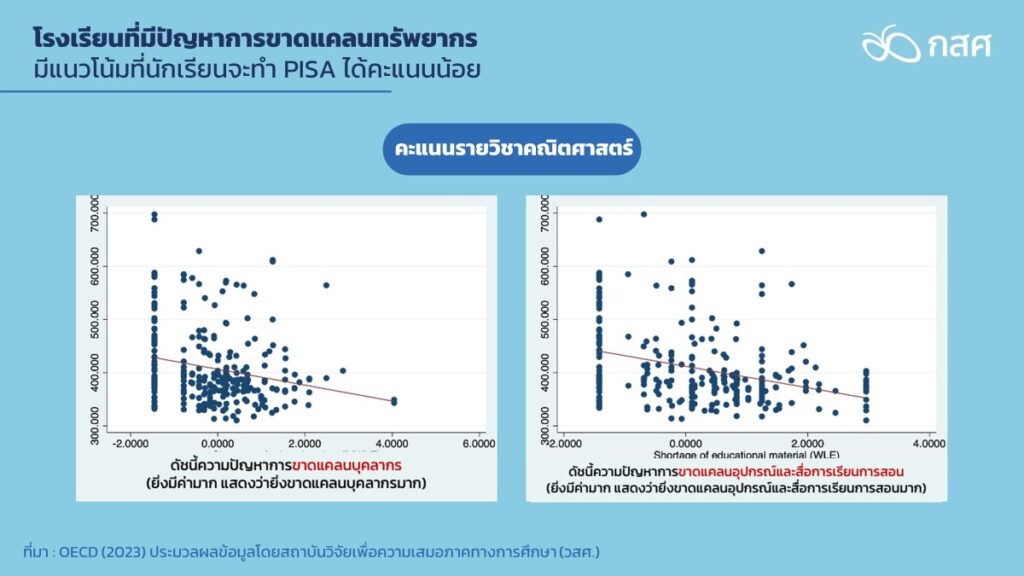
Furthermore, when looking at school-related criteria, we see that institutions with insufficient staff, supplies, or equipment typically do worse than those with greater resources.
Thus, this could be an additional element influencing the quality of instruction and learning outcomes, as demonstrated by Thailand’s PISA 2022 evaluation results.
Source: Data processed by Equitable Education Research Institute (EEFI) from the OECD (2023).
Starting with data analysis, policy recommendations are made to improve the Thai education system and lessen inequality.
As the Equitable Education Research Institute’s (EEFI) Acting Head of Systematic Research and Project Evaluation, Mr. Kittisak Kaweekijmanee said that one measure that will assist us determine the direction of education policy is the analysis of data from Thailand’s PISA test results. According to the above data analysis’s findings, the nation should implement significant measures in four areas to lessen educational inequality, particularly in the domain of education:
1. Promote talented poor children or Academically Resilient Students to receive education to the maximum of their potential, focusing on reducing barriers to accessing education during transitional levels. Whether it is access to educational funding sources and increasing awareness of scholarship opportunities for further study at a higher level, the educational management model of educational institutions should be developed to be flexible enough to accommodate the education of students who have limitations whether in terms of economic status or other aspects. In addition, it should push for the allocation of educational resources to small schools in remote areas to be more adequate and sufficient to provide quality teaching and be able to fully utilize the potential of Academically Resilient Students. This should focus on mobilizing resources from other sectors to participate in raising educational equality levels, such as the private sector, local government organizations and civil society sector, etc.
2. Supporting systems that bring families and schools together so that families may take a more active part in helping students learn and can hear what students have to say about their education and provide feedback that helps solve problems head-on. Families and schools must work together to promote physical and mental well-being, evaluate student performance, and strike a balance between in-class and out-of-class learning.
3. Both within and outside of the classroom, activities or standard learning methods can be integrated with activities that foster a growth mindset, such as the use of positive communication approaches. In order to encourage goals for education and a future outlook for both children and families, information about occupations, potential income levels, etc., is provided to parents and/or families as well as children. This will help to foster motivation in self-directed learning.
4. By creating assessment tools as an alternative to teachers or granting teachers the freedom to create or select learning assessment tools that are appropriate for students and school contexts, there is capacity building and opportunity for teachers to use tools to assess learners’ progress during learning (formative assessment). This manner, rather than waiting until the conclusion of the semester or academic year, teachers may evaluate the child’s progress or identify any learning gaps along the road, allowing them to modify their strategy or get ready to close any gaps in knowledge. It might be too late to close the existing learning gap at this point.
