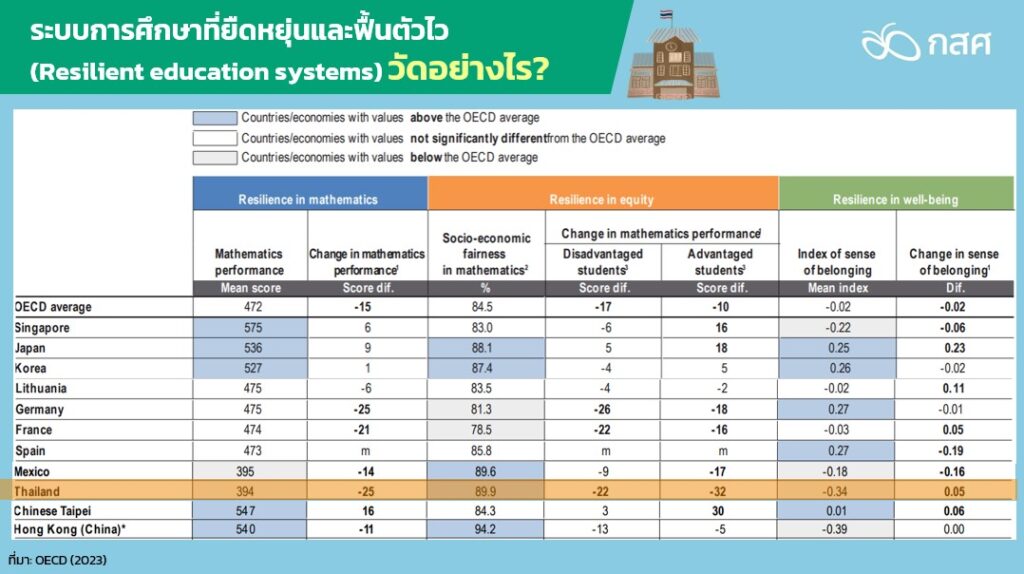
In December 2023, the PISA 2022 test results were made public. It provides reading, science, and math exam results for each nation together with information about the educational environment of the school and a survey of students’ opinions about life at home and at school. These diverse data from the Organization for Economic Co-operation and Development, or OECD, have made it clear that each nation needs to examine and evaluate them in order to offer empirical support for the evolution of its educational system. Data on robust, resilient, and fast-recovering educational systems—sometimes referred to as “resilient education systems”—have also been made public by the OECD. These systems take into account three factors:
1. PISA scores are used to gauge academic performance (Performance). The score in mathematics needs to be at least as high as the level in 2018 and as high as the average score across OECD nations.
2. The equality of PISA math scores (Equity), which is determined by the socio-economic fairness index (Socio-economic fairness in mathematics), which influences the math test score, must have an index level that is at least as high as the OECD average. Additionally, test scores from both high and low socioeconomic parity groups cannot be lower than what they were in 2018.
3. The Index of Sense of Belonging, which gauges Well-being, needs to be at least as high as the OECD average and as low as it was in 2018.
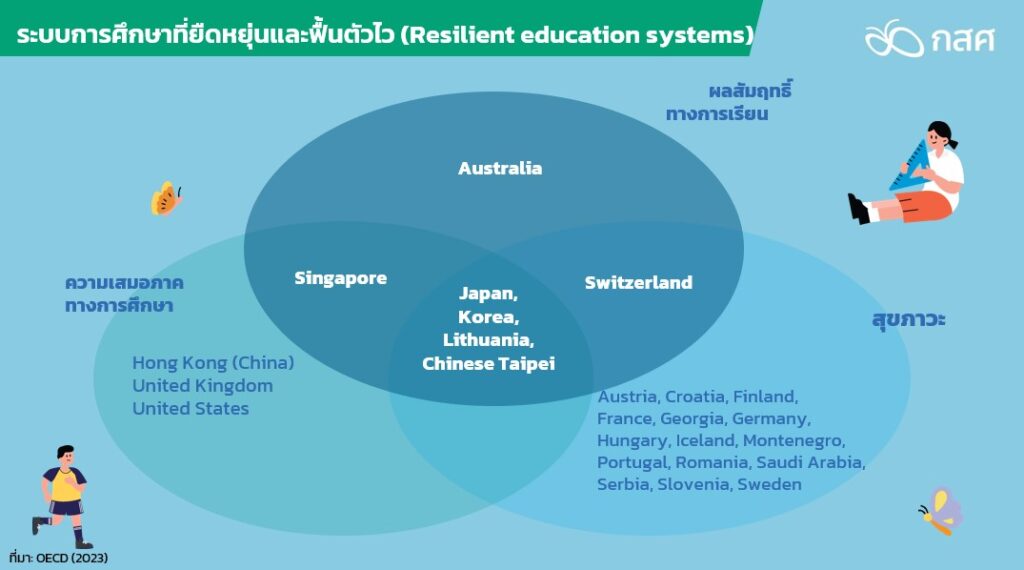
Source: OECD (2023)
From the above criteria, it can be found that there are four countries or economic zones that are considered to have resilient education systems: Japan, South Korea, Lithuania, and Chinese Taipei. For Thailand, if we consider the above information and criteria, it will be found that it does not yet meet the criteria for having a resilient education system according to the OECD definition. In terms of test scores, they are still lower than the average of OECD countries and lower than in 2018.
Meanwhile, the equality dimension of the PISA Mathematics score is better than the OECD average (higher scores reflect better equality). However, test scores for affluent and poor students decreased compared to 2018. As for the dimension of well-being, although it has begun to see an improvement in direction compared to 2018, it is still at a level lower than the OECD average.
Source: OECD (2023)
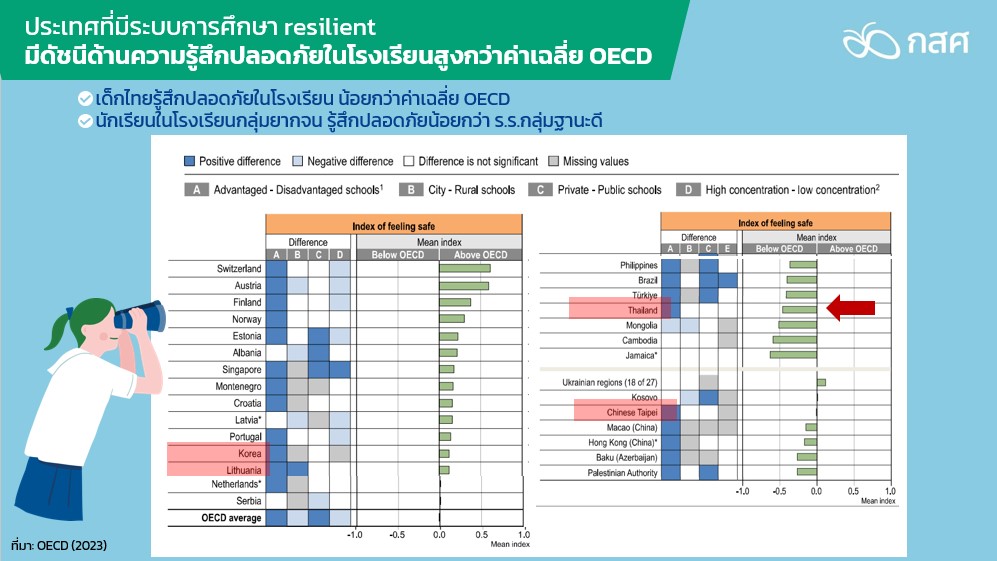
A resilient education system has many intriguing components that mirror many facets of the school environment, particularly when it comes to matters that are in line with student health and uphold the values of equitable, high-quality education.
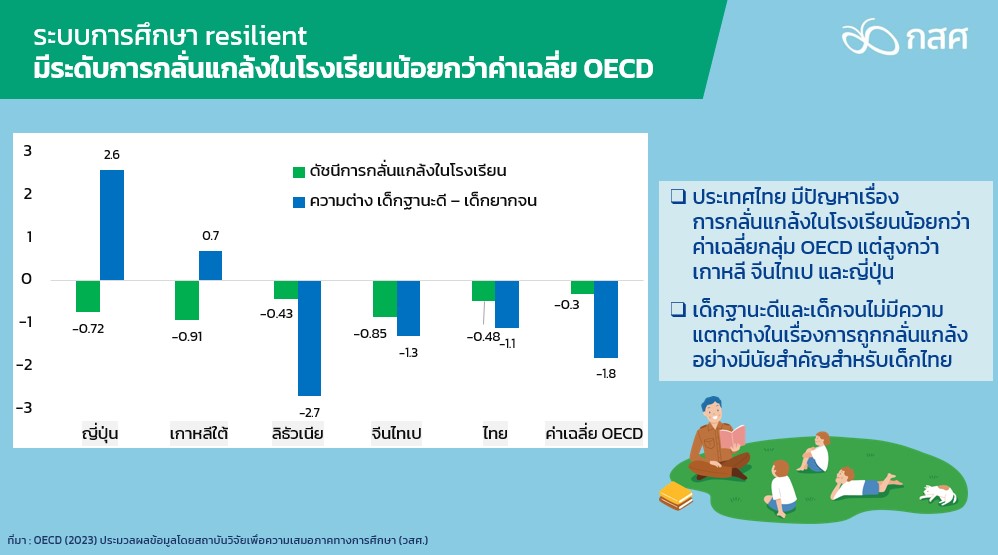
Initially, we discovered that the indicator of feeling safe in schools is greater in nations with resilient education systems than in the OECD average. According to the OECD, kids’ experiences of feeling unsafe at school are linked to the dangers they encounter there, including violence, property damage, and peer harassment. Furthermore, the index of exposure to bullying indicates that schools with resilient education systems have lower rates of bullying than the average for all OECD countries. The degree of bullying decreases with a higher negative index value.
Stronger feelings of belonging, increased self-confidence, greater potential for self-directed learning, and greater life satisfaction are among those who feel comfortable at school and encounter less bullying there. An examination of data from Thailand reveals that, compared to the average of OECD nations, Thai youngsters feel less secure at school. To be more precise, pupils at schools with lower socioeconomic backgrounds felt less secure than students in schools with better socioeconomic backgrounds. While it is greater than in Korea, Chinese Taipei, and Japan, Thailand’s rate of school bullying is still lower than the OECD average.
Source: OECD (2023)
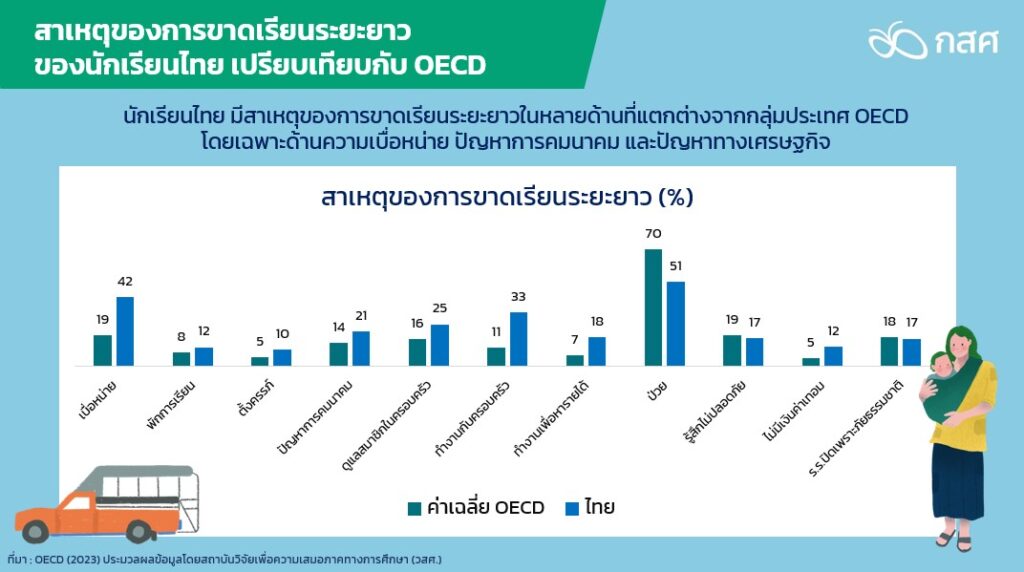
Second, compared to the average of OECD countries, which is 7.6%, a resilient education system will have fewer pupils with a history of long-term absences from school (three months or more) (Picture 5). Long-term absences from school will affect academic achievement more when they happen at a higher educational level than when they occur at a lower level.
Comparing high school students with a history of long-term absences from school to those without, the former saw a 59-point decline in PISA math performance. In the meantime, elementary school absenteeism lowers test performance by 35 points compared to pupils who never miss class.
Thailand has a higher than average rate of long-term absenteeism from school (10.3%) compared to other OECD countries. Long-term absenteeism will be more common among students in schools with a low mean level of student economic status than in those with a higher mean level.
Source: Data processed by Equitable Education Research Institute (EEFI) from the OECD (2023).
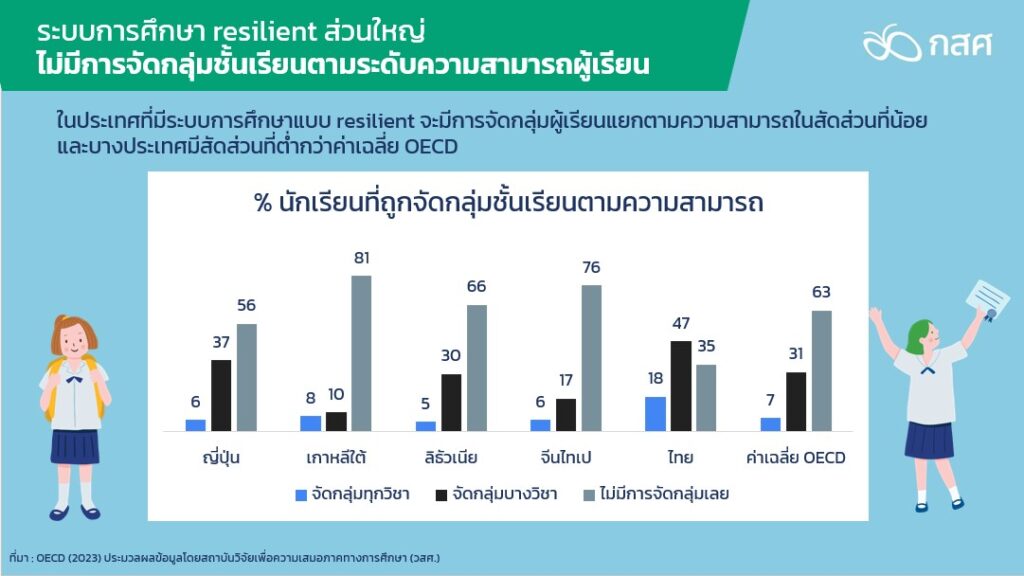
Third, most resilient education systems have less ability grouping than OECD countries. The OECD’s PISA 2022 Results: Learning During – and From – Disruption report documents evidence from research showing the benefits of ability-based grouping on academic achievement in primary school. Only some subjects should be grouped in classes based on ability. Additionally, grouping needs to be flexible (Matthews, Ritchotte, and McBee, 2013; Slavin, 1987). However, assigning kids to ability-based groups could not be entirely helpful if schools fail to offer each group the proper training or fail to give them the chance to learn from Better peers (Hong et al., 2012; Lucas, 2001). According to the most recent PISA test results, students studying in environments where pupils are grouped based on ability receive different PISA scores in mathematics than students studying in environments where they are not. The change is very little. According to OECD score data, pupils who study independently of ability groups typically achieve higher scores. Nonetheless, this discrepancy might be explained by the fact that struggling students are more common in schools that assign pupils based on aptitude. Additionally, some pupils’ intellectual abilities differ more than others’.
It is discovered that, in comparison to the OECD average, a larger percentage of Thai students are categorized based on their academic performance, either grouping all subjects or just some of them. But the answer to the questions “Are we in the king’s classroom?” and “Are we grouped together or not?” could not be the solution. But what exactly do we learn from setting up these classes? Does it actually aid in the learning of the students? And how can we provide a setting where students of various academic backgrounds can share information with one another to further their personal growth?
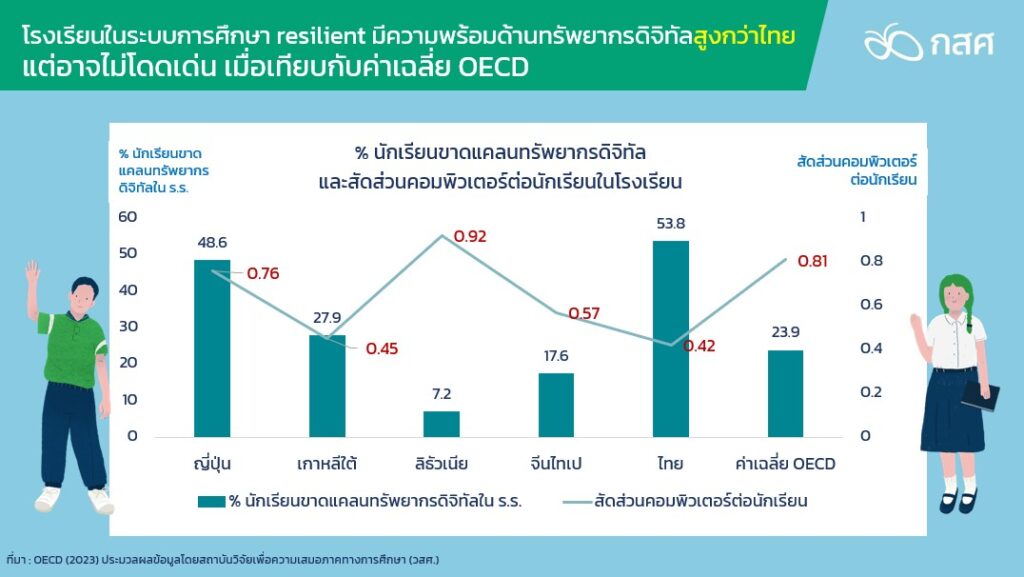
Fourth, while they might not yet stand out above the OECD norm, schools in resilient education systems are more prepared for digital resources than schools in Thailand. The proportion of computers per student in schools is lower than the OECD country average, and schools in South Korea and Japan reported higher percentages of students lacking digital resources (including desktop and notebook computers, internet access, and learning management systems) than the OECD school average.
In the context of Japan and South Korea, other systemic issues may have a greater influence on students’ academic accomplishment, even though a lack of digital resources for learning generally has a negative impact on academic achievement. For example, an education system that is so competitive that it creates a system of “shadow education” or supplementary learning outside of regular classes, etc.
On the other hand, the OECD report points out that just having a sufficient number of computers does not always guarantee better learning outcomes. Equally importance than having modern technology is having a method for using it that is appropriate and does not create a negative impact on learners. This will help promote schools to be more prepared to provide education with digital technology and have good results for student learning.
Source: Data processed by Equitable Education Research Institute (EEFI) from the OECD (2023).
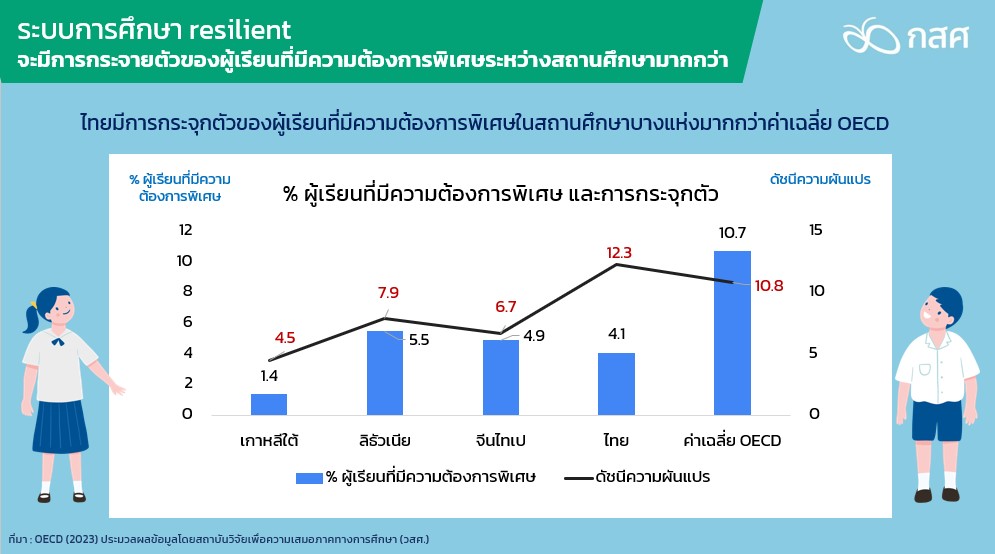
Fifth, compared to the education systems of OECD nations, countries with resilient education systems have a higher distribution of students with special needs across educational institutions. It is an expression of the variability index of the percentage of pupils in the educational system who have exceptional learning requirements. (The higher the value, the more it indicates how concentrated these student groupings are in particular schools.) This exemplifies the inclusive education concept.
Meanwhile, Thailand has a higher concentration of students with special needs in some educational institutions than the OECD average. This suggests that Thai students with special learning needs still need to attend specialized schools for special groups of students. While general schools may not be ready to organize inclusive learning, they require readiness in terms of infrastructure, learning space, equipment, and learning facilities. In addition, there should be personnel who have understanding and skills in managing inclusive education so that students with special needs can learn and live in school with the general group of students without discrimination.
Based on the evidence provided above, we may infer the following policy implications for fostering an environment in the classroom that will contribute to Thailand’s transition to a more resilient education system:
1. To help children feel comfortable and included in the school, a strong emphasis is placed on creating a safe environment within the building and on managing and preventing bullying issues in schools.
2. There is support for the creation of shared learning environments in which student groups with disparate backgrounds, scholastic standing, and physical attributes can collaborate to make the school a model of the actual world. It can help those who are able to adjust and are prepared to live blissfully outside of civilization.
3. There should be a more in-depth understanding of the problem of long-term absenteeism. Because such problems may be different for each group of students, we also attach importance to the system for tracking academic assistance for students who need to be absent from school in the long term. In addition, a flexible educational model has been developed to accommodate students with various limitations in order to meet their life and work needs. Surveillance systems are in place to identify at-risk students to prevent the problem from escalating from long-term absence to complete disengagement from the education system.
4. Activities that cultivate a growth mindset are supported such as using positive communication techniques. It may be combined with activities or normal learning methods both in the classroom and outside the classroom. Information on careers and possible future income levels, etc., is provided to create motivation to pursue education at the highest level according to each person’s potential, which will lead to the development of motivation in self-directed learning.
5. An ecosystem is established to make it easier to harness digital technology’s potential for learning without negatively affecting it. Guidelines exist, for instance, on how to use digital gadgets to support learning behavior without endangering one’s physical well-being. The ability to reflect on data literacy is developed. Technology use extends education without sacrificing the fundamental skills that all students should possess, such reading and numerical literacy.
Mr. Kittisak Kawikitmanee, Acting Head of Systematic Research and Project Evaluation
Information sources
- Matthews, M., J. Ritchotte and M. McBee (2013), “Effects of schoolwide cluster grouping and within-class ability grouping on elementary school students’ academic achievement growth”, High Ability Studies, Vol. 24/2, pp. 81-97, https://doi.org/10.1080/13598139.2013.846251.
- Slavin, R. (1987), “Ability Grouping and Student Achievement in Elementary Schools: A Best-Evidence Synthesis”, Review of Educational Research, Vol. 57/3, pp. 293-336, https://doi.org/10.3102/00346543057003293
- Geijsel, F., M. Krüger and P. Sleegers (2010), “Data feedback for school improvement: The role of researchers and school leaders”, The Australian Educational Researcher, Vol. 37/2, pp. 59-75, https://doi.org/10.1007/BF03216922.
- Gustafsson, J. et al. (2015), “From inspection to quality: Ways in which school inspection influences change in schools”, Studies in Educational Evaluation, Vol. 47, pp. 47-57, https://doi.org/10.1016/j.stueduc.2015.07.002.